Panel data — fixed effects
linearmodels.PanelOLS (entity, time, or two-way fixed effects),
RandomEffects, BetweenOLS, AbsorbingLS, and FamaMacBeth are
each handled by a dedicated adapter. The session API is unchanged.
import numpy as np
import pandas as pd
from linearmodels.panel import PanelOLS

from pymargins import Margins

rng = np.random.default_rng(13)
n_entities, n_periods = 200, 6
entity = np.repeat(np.arange(n_entities), n_periods)
period = np.tile(np.arange(n_periods), n_entities)
df = pd.DataFrame({
    "entity": entity, "period": period,
    "x": rng.normal(0, 1, n_entities * n_periods),
    "alpha_i": np.repeat(rng.normal(0, 1, n_entities), n_periods),
}).set_index(["entity", "period"])
df["y"] = 1.0 + 0.6 * df["x"] + df["alpha_i"] + rng.normal(0, 0.5, len(df))

fit = PanelOLS(df["y"], df[["x"]], entity_effects=True).fit(
    cov_type="clustered", cluster_entity=True
)
AME of x with cluster-robust SEs
The fit’s clustered covariance is consumed automatically — the
session does not need a separate vcov= argument when the model
already carries one.
m = Margins.linear_scale(fit, at="overall")
print(m.dydx("x").summary())
======================================================
          Margins Result (delta, level=0.95)
======================================================
   estimate  std err        z  P>|z|  [95% Conf. Int.]
------------------------------------------------------
x    0.6004   0.0157  38.2756  0.000    0.5696, 0.6311
======================================================

n = 1200
κ: 0.000
Delta-vs-sim disagreement: 0.246%
Predicted y at representative x
Entity and time fixed effects are absorbed during estimation; they do
not appear as explicit regressors in the margin calculations.
Predictions are therefore evaluated at the population-averaged
profile (or the representative profile you specify with at=).
print(m.predict(atexog={"x": [-1.0, 0.0, 1.0]}).summary())
=============================================================
           Margins Result (simulation, level=0.95)
=============================================================
        estimate  std err  statistic  P>|z|  [95% Conf. Int.]
-------------------------------------------------------------
x=-1.0   -0.5996   0.0157    -0.5996  0.000  -0.6301, -0.5687
x=0.0     0.0000   0.0000     0.0000  1.000    0.0000, 0.0000
x=1.0     0.5996   0.0157     0.5996  0.000    0.5687, 0.6301
=============================================================

n = 1200
WARNING — Fallback triggered: kappa=inf>threshold=0.3
κ: max=inf
/home/hunter/Workspace/pymargins/pymargins/margins/_session.py:875: UserWarning: Delta-method curvature κ=inf exceeds threshold (0.3, stacklevel=2); falling back to simulation.
  result_data = run_inference(
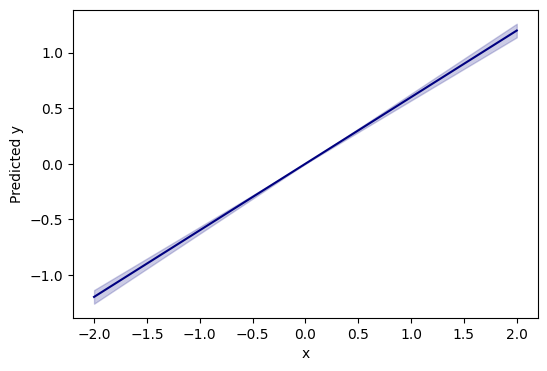
Plot: predicted outcome over representative x
import matplotlib.pyplot as plt

x_vals = np.linspace(-2, 2, 50)
res = m.predict(atexog={"x": x_vals})
df_plot = res.to_frame()

fig, ax = plt.subplots(figsize=(6, 4))
ax.plot(df_plot["x"], df_plot["estimate"], color="navy")
ax.fill_between(
    df_plot["x"], df_plot["ci_lower"], df_plot["ci_upper"],
    alpha=0.2, color="navy"
)
ax.set(xlabel="x", ylabel="Predicted y")
[Text(0.5, 0, 'x'), Text(0, 0.5, 'Predicted y')]
See Cluster and block bootstrap for cluster-resampling bootstrap in panels where the analytic clustered SE is suspect.